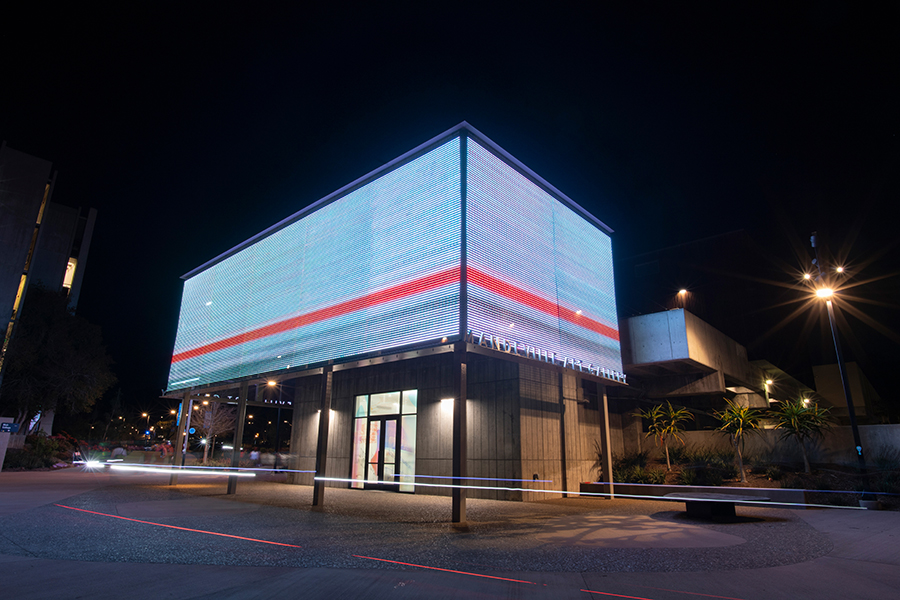
Data Tales
June 3 - September 25, 2026
Data Tales showcases datasets reimagined by guests and students of VIS 141B. Our students have used python coding to develop their visuals on the Media Mesh. The genre of visuals ranges from GEN Z humor to light-hearted work, as well as visuals that our society should reflect on. Our data visualizations are here to be your summer tales to tell.
Participating Artists: Ashley Chen, Stephanie Pan, Amy Sara Carroll, Lucian Woo, Darlene Apostol, Melinda Dang, Kya Vu, Llewelyn Jang, Shreya Krishnamurthy, Laura Marcial, Anthony Ly, Meena Kolli, Regina Kim, Astrid Liong, Kimberly Lau, Joy Shin, Tatum Stacey, Thorsaeng Thanopajai, Boru Wang
Artists & Works
Ashley Chen
Identity as data
This project explores how systems/computer treated people(here using anime face) as data, lose individuality and become interchangeable visual patterns. The project make identity been through ordered title, clustering color, robotic and dissolution. Trying to show when integrated into the system, the uniqueness of each individual converts into piece of data and no longer retains its particularity.
Stephanie Pan
WHAT PPL HV MADE ON TIKTOK
My project explores how “going viral” is often the result of algorithmic luck rather than meaningful value. Many of these frivolous moments are labeled as high-performing content on TikTok despite having any significance. Rather than discouraging creators, this project tries to encourages users to engage social media intentionally and for personal benefits, instead of chasing clout.
Amy Sara Carroll
Woe Is Not Me
Woe Is Not Me is one of several concrete poems that I have recently written. It responds to the current sociopolitical climate, serving as a reminder to self to keep the faith.
Lucian Woo
Gamicorn and the Rainbow Trail
A data visualization where a unicorn called the Gamicorn scrolls across, with a rainbow trailing behind it. The movement of the rainbow is driven by global video game sales data, going higher and lower depending on the value being read.
Darlene Apostol
Road Rage on Mario Circuit
A data visualization that combines a road rage data set and a Mario kart data set. The characters are represented by small colored circles and they loop around the track and the ones that that are on the fire have a higher road rage.
Melinda Dang
Discordance
A random compilation of the artist's Discord messages sent between 2017 and 2026 visually compared to the audio features (energy, happiness, etc.) of the songs that they were listening to when the messages were sent.
Kya Vu
BioRelics
BioRelics is a generative piece that compares multiple genomic sequences and shifts text structures in a way where moments of similarity create temporary coherence, while mutations and divergence produce fragmentation. The piece uses ASCII imagery of figures assembling DNA strands as a symbolic framework for reconstruction and reflects on how identity persists even through imperfect replication as a relic of time.
Llewelyn Jang
Hong Kong MTR: The Metroform
A data visualization of the Hong Kong Mass Transit Railway (MTR), mapping station locations using latitude and longitude data. The visualization follows trains as they move through the network that shapes Hong Kong’s daily rhythms and connects people across the region each day.
Shreya Krishnamurthy
Snakes in Our House
"Snakes in Our House" is a tribute to the victims of the persistent violence of serial killers. This generative visual piece is built from a database of serial killers and their victims. Names scroll endlessly across a moving marquee, transforming data into a living landscape: victims appear as flowers in a field, some bearing names spelled across their petals, many others remaining anonymous as mere blooms. Snakes weave through the flowers in constant motion, embodying the quiet, persistent presence of violence moving among ordinary lives. By contrasting delicate growth with predatory movement, the work reflects on visibility, erasure, and the overwhelming number of victims whose names are lost to history. It reminds everyone that behind the stories of these serial killers, is an endless count of real people whose lives are torn apart by particularly cruel acts of violence.
Laura Marcial
vivir - PAGAR - Temporalmente
It is a poem in which I address the problems of public transportation in Jalisco, Mexico: bureaucratic gridlock, fare increases, and travel times due to chaotic infrastructure.
Anthony Ly
Income Heartbeat
Heartbeat reflecting SJ housing cost and income ratio
Meena Kolli
Star Death
This is a data visualization showing a map of stars, with red giants highlighted and falling down as they are at the end of their lives.
Regina Kim
Human or AI?
A gamification of seeing how much AI has forcefully integrated itself into our lives, and whether we can differentiate AI from human responses. These responses are all pulled and used in news, articles, and other journalism.
Astrid Liong
my music universe
Hello! Please enjoy my data visualization featuring my own Spotify data! Ranging from the beginning of my Spotify history to now, the planets represent the artists I've listened to, with size varying on how much I've listened to them. I chose to display my data in a space setting to represent the idea that I feel like I'm always in a different universe whenever I listen to different types of music.
Kimberly Lau
Falling Leaves
This piece is a acknowledges important Cantonese and Chinese American films, displaying colors from different stills in order to represent these films. As the colored leaves fall, it symbolizes the impact that these films leave on their communities, and the potential for growth from the paths these films paved.
Joy Shin
Gospel in Motion
Using the New Testament scripture database as source material, the project transforms biblical text into a flowing landscape of colors that drift across the ultra-wide display. Rather than presenting scripture as readable text, each verse becomes a luminous visual fragment whose color, brightness, and scale are determined by its word count, turning language into a system of embodied visual intensity. The result is a digital stained-glass environment that responds to biblical structure while remaining abstract and atmospheric. It positions scripture as a form of generative light: part data visualization, part devotional field, and part contemporary media installation that transforms sacred text into a shifting architecture of color, motion, and perception.
Tatum Stacey
sta.AI.ned glass
Various images of stained glass created by different AI. This explores data of a form of art that makes up thousands of windows across thousands of catherdrals and churches across Europe. My work explores the limits of AI being able to depict these gorgeous handcrafted windows as well as the surprising results they were able to create, along with some of my own personal touches.
Thorsaeng Thanopajai
do you got plans tonight?
This digital installation is a personal visualization of my own travel history, specifically mapping my departures and arrivals to and from the United States from my first arrival in 2022 up to the present day. The piece uses a wide, panoramic layout to represent this timeline as a continuous, 1.5-minute journey. The background features an intentional vertical gradient that fades from solid black to baby blue, paired with twinkling ambient stars to establish a clean, atmospheric space. A single airplane travels steadily from left to right across the mesh, leaving a colorful, pixelated rainbow trail in its wake. As the plane advances, it follows a dynamic path that connects five floating destination stars arranged in rainbow order; when the aircraft reaches each star, the location pops and triggers a small visual shockwave, marking a specific milestone in my personal journey before the animation concludes.
Boru Wang
This Is Too Much To Explain With A Title (An Avian Wireframe)
This piece is a distributed, generative wireframe that visualizes the invisible architecture of bird songs across a massive media mesh. Powered by a synchronized cluster of micro-computers and localized artificial intelligence, the system acts as a real-time acoustic translator—listening to the chaotic beauty of avian calls and distilling them into a sterile, typographic vocabulary of data points, frequencies, and physical shapes.